
This write-up was by Nixintel and originally appeared on his blog.
Using OSINT to identify and investigate sources of malicious internet activity is a key part of cyber security. There’s a huge range of open source information out there to help with this, and Spiderfoot HX gathers it very quickly. This allows more time to spend on analysis of the data to help assess the nature of the malicious activity, what kind of threat it poses, and build a wider picture of the infrastructure around it.
In this tutorial we’ll see how to configure Spiderfoot HX to scan for information about a malicious IP address, and then use the in-built analytics tools to learn as much as possible about the target.
The Target
For this tutorial, we’re going to look at IP address 59[.]46[.]156[.]182. It has been reported as potentially malicious by AbuseIPDB.com so we’re going to dig into it a little further and learn as much about it as we can:

AbuseIPDB logs suspicious IP addresses as they are automatically flagged and reported by web servers, so there must be something suspicious about this IP address – but what? We can use Spiderfoot HX to gather a lot of information about this target very quickly and then analyse it to learn as much as possible. In a more realistic scenario, this IP address might have appeared in firewall logs or be in the header of a phishing email you’ve received.
Setting Up
Spiderfoot HX comes with a wide range of built-in modules to help with different types of OSINT gathering. This allows a large number of resources to be queried very quickly so that a picture of the target can be built up in just a short time. Most of the modules that come with Spiderfoot HX don’t require API keys, but adding a few API keys allows Spiderfoot HX to get results from databases like Shodan, VirusTotal, and RiskIQ and helps build a much richer intelligence picture.
To add API keys to Spiderfoot HX, from the home screen choose Configure > API Key Manager. Next choose the module that you’d like to add an API key for. In this case, I’m going to add an API key for abuseipdb.com:

Paste to API key into the relevant field and click on “Save Changes” to continue.
There’s no need to do this prior to running each scan. Once an API key has been added to your Spiderfoot HX it is saved as part of your user profile.
Configuring A Scan
Spiderfoot HX features over 170 modules that query and analyse a wide range of different sources. To get set up for a scan, from the homepage choose Scan > New Scan.

The Scan Profile is set to ‘All Modules’ by default. but not all of them are relevant for every kind of search and using all of them can make the scan take longer and chew up API credits. To make the search more efficient we can disable any modules that aren’t relevant to the kind of search we’re conducting.
To select the preferred modules, click on “Select individual modules”.

The module set-up screen lists all the available modules and gives a brief description of the kind of data each one finds. To disable a module, simply uncheck the box. The purpose of this particular scan is to learn about a specific IP address, so modules like MySpace can be disabled, because it isn’t going to return the kind of information that we want on this occasion. Any other modules that aren’t needed can be disabled in the same way.

Once you’ve chosen the modules you want, you’re almost ready to begin the scan.
Tip: There’s no need to reconfigure your module choices for every single scan; if you want to run another scan with the same modules enabled but against a different target, simply clone the scan you’ve already configured and simply specify different targets.
Finally we need to add the target IP address! Add the IP into the relevant box as in the example below:

It’s possible to scan domains, hostnames, IP addresses, ASN numbers, usernames, phone numbers, and other data types with Spiderfoot HX. Targets can be imported as a single column list from a file or even from Hunchly exports.
Once the target is entered, click “Run Scan Now” to start.
Scanning
Spiderfoot HX returns results as they are gathered, so there is no need to wait for a scan to be completed before beginning to analyse the data. After launching the scan, the results can be seen in real time in the Overview window:

The Overview window continuously updates as the scan progresses. The scan on our target IP only took a few minutes to complete and left the Overview window looking like this:

The scan for OSINT relating to our suspicious IP address returned a total of 484 data points. That’s very useful, but what does it all mean? How to these data points all tie together? What kind of intelligence report can we piece together from the raw data that Spiderfoot HX has gathered?
Gathering data is one thing, but the real value of OSINT is being able to tie the data together into intelligence that is useful and actionable. Next we’ll look at how Spiderfoot HX’s visualisation and analysis tools work to help better understand that information that we’ve gathered on the target IP address.
Analysis and Visualisation
To see all the data returned by Spiderfoot HX, click on “Browse By” and select “Data Type”.
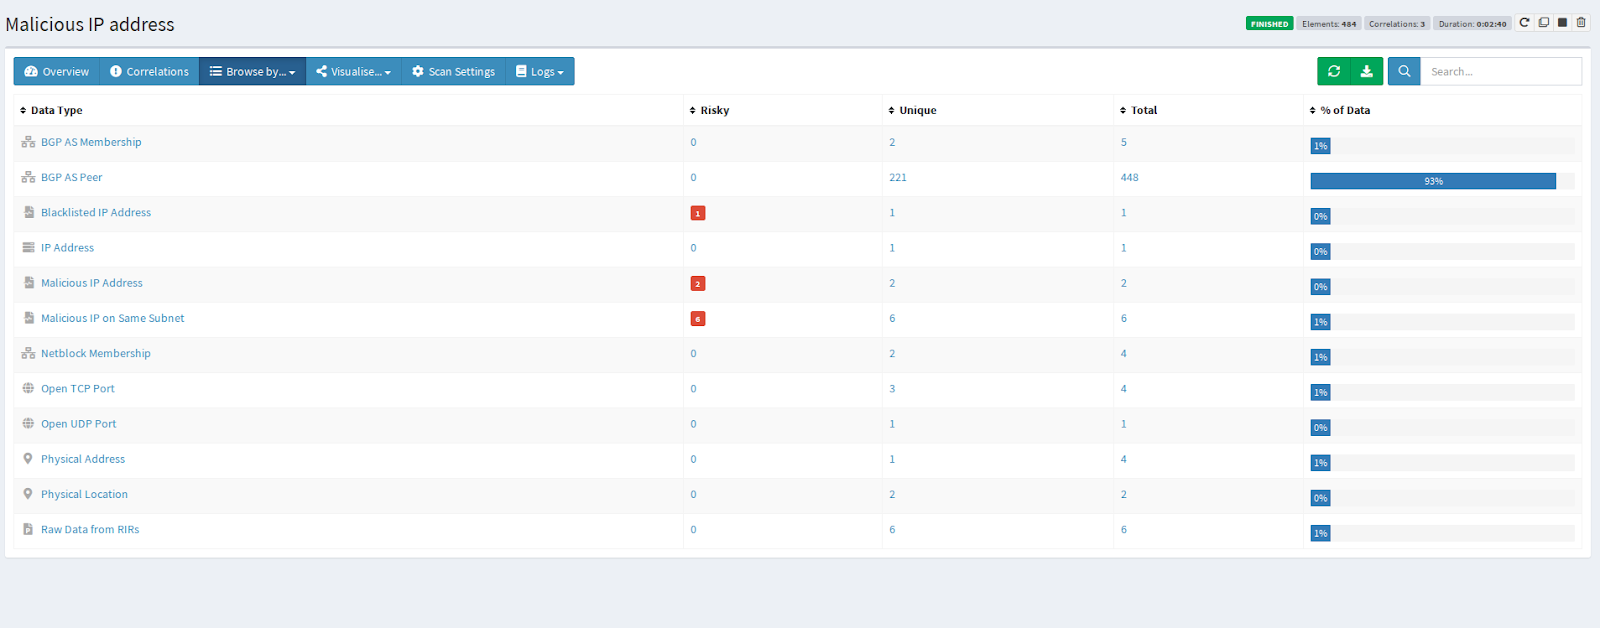
The search results above are organised by category – but where do we start with analysis? It’s one thing to have a large collection of data, but we need to analyse it and understand what the data means. Who does this IP address belong to? Is it malicious, or is this just a false positive? What type of threat does it pose? How concerned do I need to be? How do I protect my network? And so on.
Spiderfoot HX evaluates the data it retrieves and highlights areas of potential risk. These are highlighted in red in the results table or they can be accessed directly from the Correlations menu. To explore further either click on the relevant part of the Correlations graph in the Overview menu chart or click on the “Correlations” tab in the Overview panel.

Here are the findings:

Three different sources also consider the target IP address to be malicious. To see which ones, click on the number in the “Data Elements” column.
The first set of results show that AbuseIPDB, AlienVault, VoipBL, and Blocklist all consider this IP to be malicious because it’s coming from the same subnet as another malicious IP.

However Spiderfoot HX shows that not only is the IP part of a subnet with a malicious history, but both SANS and WatchGuard have identified this specific IP as malicious:
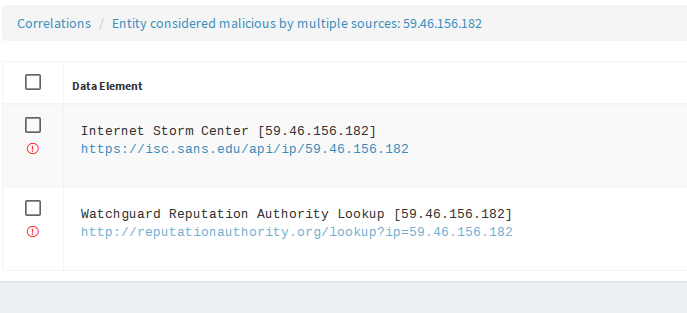
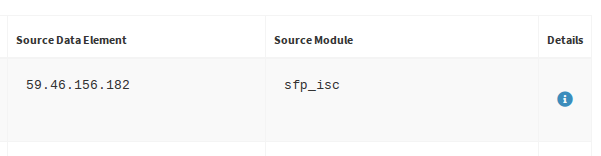
To expand on this a little further, click on the small blue Info icon at the end of each row.
So out of the 482 data elements that were returned in the original search, Spiderfoot HX highlighted the areas of greatest risk for our immediate attention. This makes prioritising our analysis much quicker and makes a good starting point to begin to visualise and link the returned data.
In this example we’re going to visualise the data that our query returned from SANS Internet Storm Center. To start the visualisation process from there, click on the Info icon in the details column:
Here’s how Spiderfoot HX visualises this piece of information:
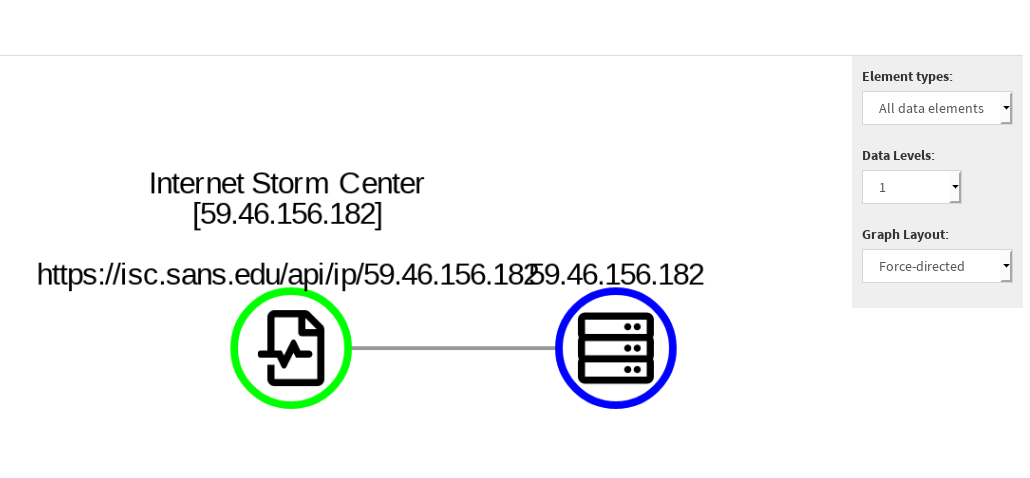
This is a simple visual representation of the link between the target IP address and a match to a known malicious IP address from SANS ISC. Changing the Data Level from 1 to 2 expands these nodes further and shows how they’re linked to the other data recovered by the original scan:

This shows other entities linked to the malicious IP address. Spiderfoot displays a wide range of data types, with each one being colour-coded:

There’s a lot of additional information here. The two nodes with red borders indicate potential risks linked to the target IP. Right-clicking on each one and selecting “Details” brings up more information. Nodes of interest can also be highlighted by right-clicking and selecting “Highlight Node” as I’ve done in the picture below:

Spiderfoot HX has a few different visualisation options. By default “Force Directed” is chosen, but the data can be represented differently by choosing an alternate option from the Graph Layout menu on the right hand side. Here’s the same set of results as above but visualised using Circle mode, which makes things a little neater in this case:

Spiderfoot HX can present a very complex series of relationships between thousands of data nodes but it is still possible to drill down into each individual node to see how it is linked to the original query by looking up the Discovery Path. Right click on a node and choose Details > Discovery Path:
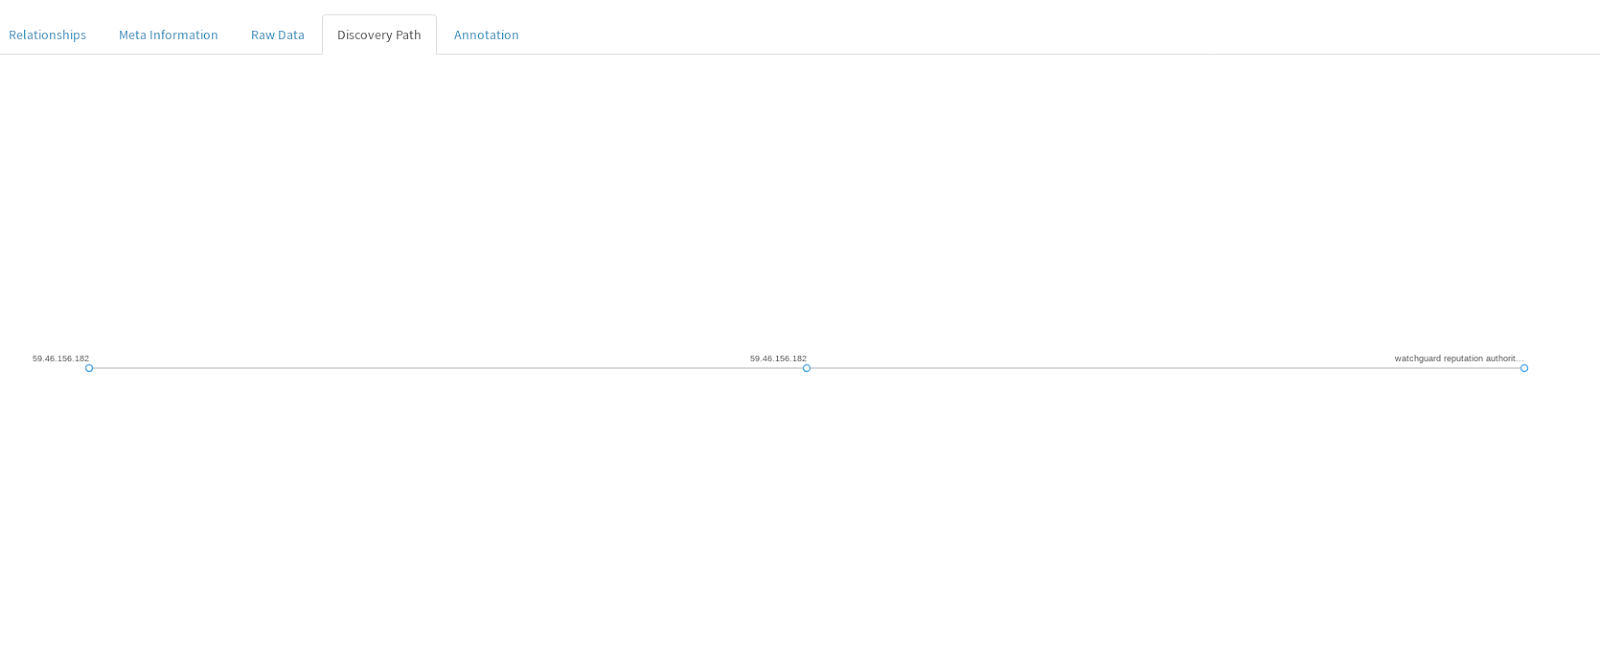
The Discovery Path displays the original scan query on the left and then traces its path to the node of interest. In this example it’s straightforward to see how the link was made from the original target IP to the WatchGuard Reputation Authority result. Discovery Path is especially helpful when dealing with a large set of results and you need to clarify exactly how one particular result is linked to the original query.
The visualisation process described above began by working from just a single data point (the malicious IP result hit from SANS ISC), but it’s also possible to visualise the relationships between multiple data points and see their Discovery Paths.
In this case we can look at how the malicious IP results from SANS and WatchGuard can be visualised. From the malicious IP scan results, click on the Visualisation icon to see the range of options:

This is what the data looks like when visualised with the “All Data Graph Node (Random)” option enabled:

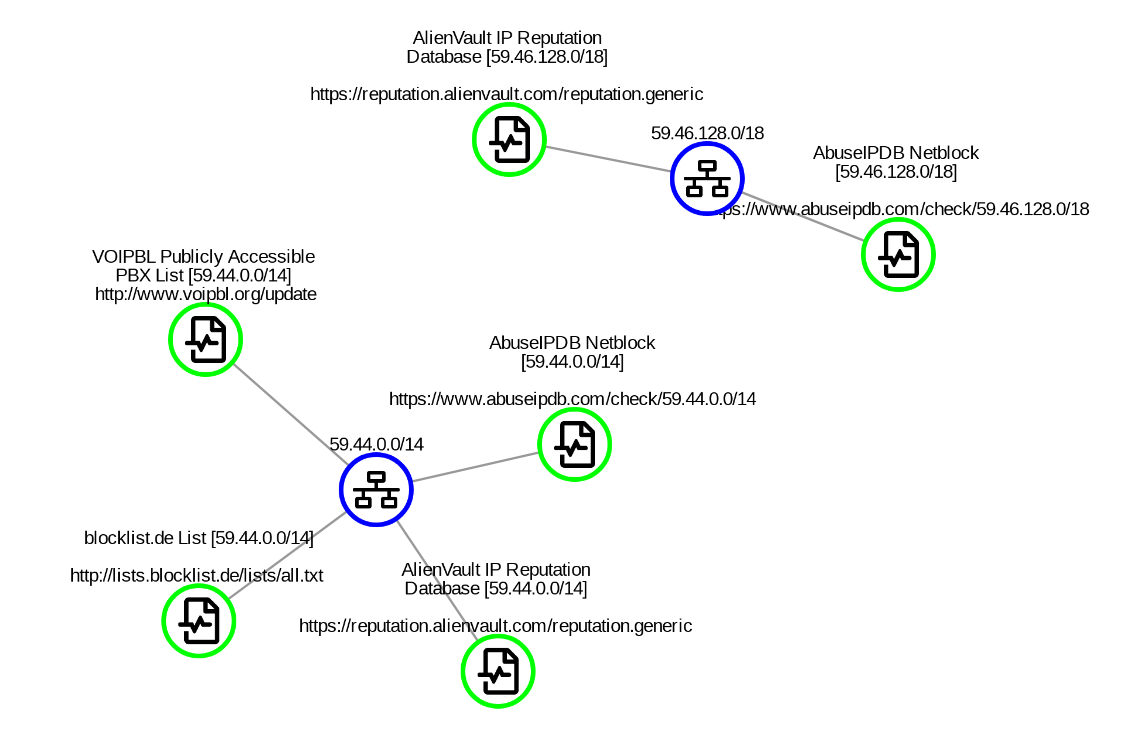
Switching from the malicious IP scan results, we can look at the wider subnet that Spiderfoot HX had also identified as containing other malicious IP addresses. Visualisation makes the connections much clearer than with raw data alone:
It’s also possible to use the same technique when looking at other types of scan results. In this case I’ve used the Chord Connection option to visualise the information about the physical location of the IP:


This gives a very detailed picture of the malicious IP very quickly, which makes evaluation and analysis of the potential threat much easier. From the initial query about a single IP address Spiderfoot HX has provided links to corroborate the malicious nature of the IP from multiple threat intelligence sources. It also reveals the open ports on the server, the wider picture of the IP’s subnet, and even the physical location of the company responsible for the IP:

Hello China Telecom!
To export your search results, choose “Export” from the menu. Data can be exported as a CSV file or in GEXF format for visualisation in Gephi.

Conclusion
In this guide we’ve seen how Spiderfoot HX can quickly scan for OSINT material relating to a suspicious IP address and analyse the data to present a detailed picture of the available associated information. We’ve seen that the IP is classed as malicious by multiple authoritative sources, that its part of a subnet known for malicious behaviour, and even the possible physical location of the owning network of that IP address.
In the next tutorial I’ll show how Spiderfoot HX can be used to investigate a domain linked to phishing.


